What is Tree Equity?
Trees are an asset: they cool and filter our air, they clean our water, and they provide us with safe and welcoming streets. We at Speak for the Trees believe that every Boston resident deserves to experience the benefits of trees in the spaces where they live, work, and play. Yet the distribution of tree canopy in Boston is uneven. In the maps below, we share some tools created by BU graduate student Raquel Jimenez who created these maps as part of her URBAN Program fellowship.
Tree Canopy in Boston
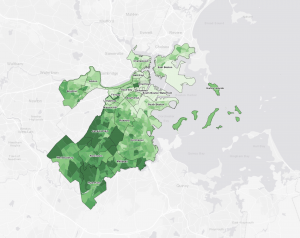
Boston’s Tree Canopy: Explore tree canopy cover. Launch the map.
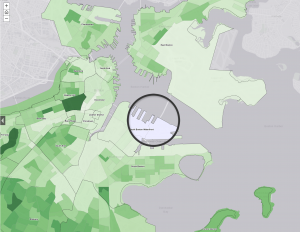
Many things make up urban spaces: buildings, parks, roads, rivers, and trees. One important way to measure the health of a city’s urban forest (yes, it’s a forest!) is by measuring the percentage of an area that is covered by trees. The first canopy map shows the distribution of tree cover across Boston’s neighborhoods and census block groups.
Use the map to zoom in and explore your neighborhood. For example, the Boston Common which will show up as a darker green shade on the map.
Our map also includes a tool to show specific trees in Boston. (Click on the second link in Chapter 1.) Where are there trees on your block ? Are they in parks? In streets? In people’s yards? Using the magnifying glass, you can zoom in to see where the individual trees are located.
If you’re looking for information on a specific street tree, you might also want to check out our inventory map created by volunteers in 2019 at OpenTreeMap or view the city of Boston’s inventory map from 2021.
Boston’s Environment
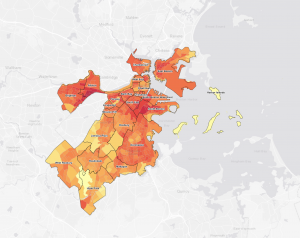
Boston’s Environment: Explore land surface temperature and PM2.5 concentrations. Launch the map.
Many Boston residents face the daily realities of climate change. In the summer the city is seeing more extended periods of high temperatures, known as heat waves. Neighborhoods with more concrete often have higher temperatures and are known as “heat islands.”
Heat waves are a public health risk, leading to increased mortality and illness, especially among some of Boston’s most vulnerable populations. Increasing tree cover is one way to reduce the severity of these heatwaves. Trees not only cast shade to reduce radiant energy, but they also serve as “air conditioners” by releasing water vapor and cooling entire blocks.
The temperature map (“Boston’s Environment”) shows the average land temperature measured in Boston during in July and August of 2019. You’ll notice how higher temperature areas tend to have more concrete and less tree cover.
Air pollution is also a major public health risk. Exposure to air pollutants has been linked to premature mortality, cardiovascular and pulmonary disease, and asthma, which disproportionately affect vulnerable groups. Since the outbreak of COVID, asthma has been cited as leading to increased health risks from the virus. This air pollution map shows the concentration of small pieces of dirt — called fine particulate matter (specifically, PM2.5) — in the air for 2016.
You can explore the relationship between these environmental issues and tree canopy in Chapter 4 of our map.
Boston’s People
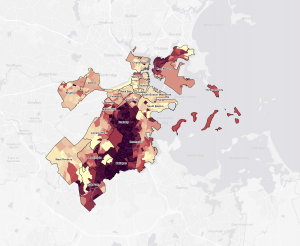
Boston’s People: Explore population demographics including percent minority, language isolation, income, age 65+, and population density. Launch the map.
Boston is a diverse city filled with people from all over the world. It is also a city segregated by race, background, and income. These series of maps explore the distribution of people in Boston.
The population maps (Chapter 3: Boston’s People) shows the distribution residents in Boston according to different demographic factors. In the first map we show the percentage of racial and ethnic minorities per census block groups. We have also included maps of other demographics, including language isolation, and household income. These groups face food and home insecurity and may not have access to resources such as air conditioning.
We have also created an age map that shows the percentage of people over 65 years old. Elderly are more prone to environmental and social stressors such as heat waves, polluted air, or social isolation. The last map shows the population density of Boston by census block group.
You can explore the relationship between demographics and tree canopy in Chapter 4 of our map.
Tree Equity: Connecting people, environment, and trees
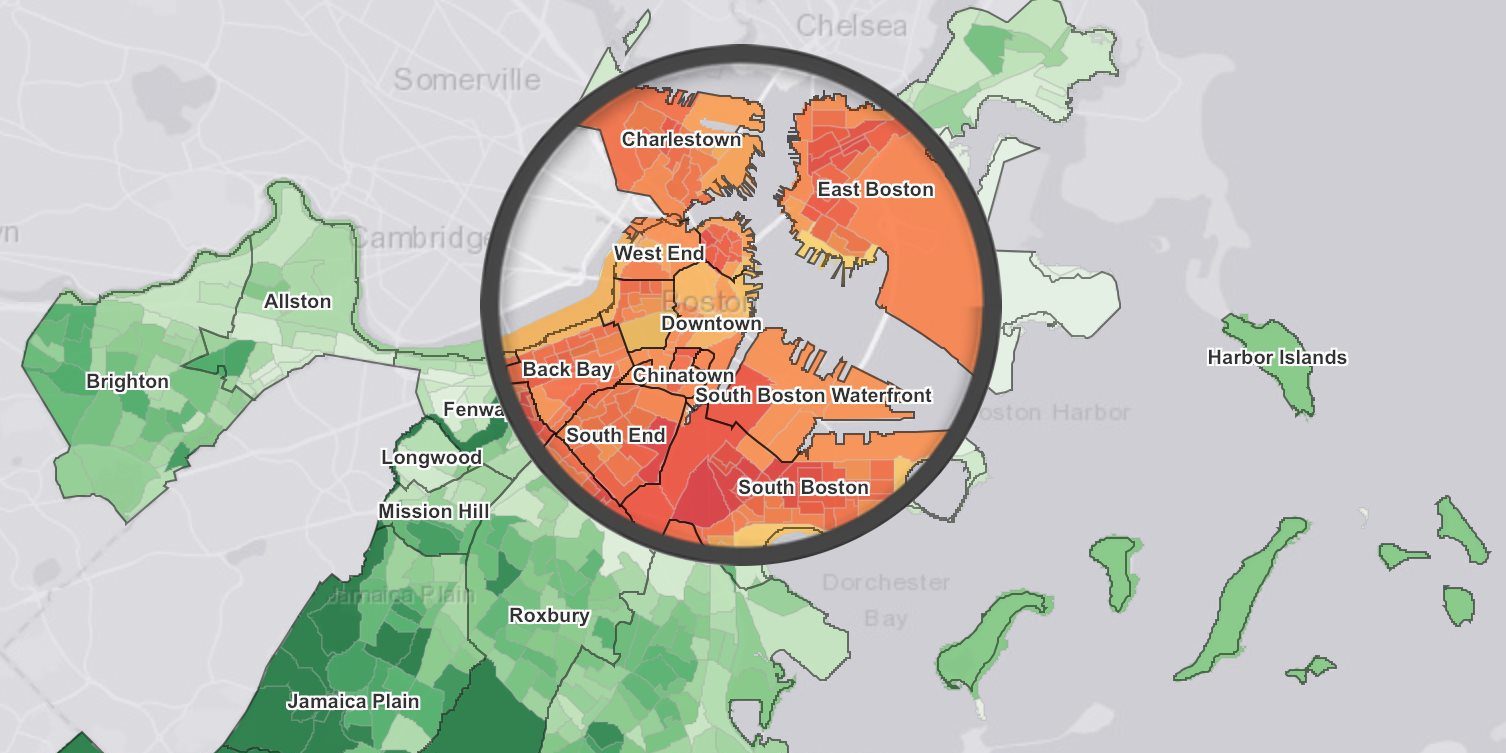
Chapter 4 includes an interactive map that overlays tree canopy data with demographic and environmental data. Move the magnifying glass to focus on a specific area.
Building Tree Equity means unpacking the inequity in our built environment, an inequity that can be traced to decades of systemic racist policies such as redlining, which led to disinvestment in certain neighborhoods . The results of these policies cast a long shadow, leading to a green line that often traces along a historical red line. The legacy of this history is literally built into the concrete of cities across the country.
We invite to to explore these relationship between people, environment, and trees, in Chapter 4 of our map series.
Growing Ahead
Try this interactive mapping tool that overlays tree canopy data with demographic or climate data. Move the magnifying glass to focus on a specific area. Launch full screen
Our maps also provide ways to plan for the future. In Chapter 5, the final chapter of our Tree Equity map series, we explore spaces where new trees can be planted.
Using publicly available data from Metropolitan Area Planning Council and land cover data from MassGIS, we have analyzed EVERY parcel in Boston and calculated how much available planting space there is for new trees. Where public information is available, we have also included ownership data.
In the coming years, we’ll be using this information to reach out to parcel owners and help them plant trees in their property. These could be schools, houses of worship, city property, or private residences. Who knows…. it could be you!
We encourage you to explore your neighborhood and share the results with your friends, neighbors, and elected officials with the hashtag #TreeEquityBoston.
A big thank you to Dr. Raquel Jimenez Celsi and Boston University’s Graduate Program in Urban Biogeoscience & Environmental Health (URBAN).